Market Action
14 June 2021 By PDSNETIn general, we encourage investors to take a medium to long-term view of the market and not to get involved in “trading” or intra-day buying and selling, especially in highly geared derivative instruments.
However, watching the intra-day progress of the S&P500 index and other indicators can be very instructive, especially from a technical perspective. The S&P is probably the most highly traded and followed of the equity indexes in the world and therefore the most technically reliable. You can watch it, real-time, from when its opens at 3.30pm South African time (or 4.30pm in our summer) at:
https://www.google.com/finance/quote/.INX:INDEXSP#scso=_OIBvXeSCL7aq1fAPq6m6iAw6:0
Consider the following example:
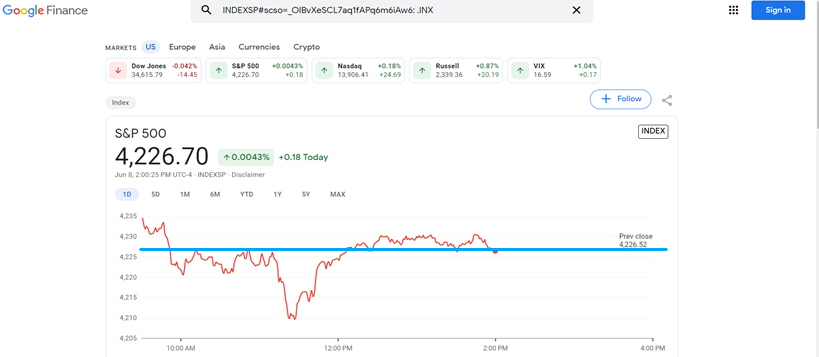
This is the intraday chart from last Tuesday, 8th June 2021. As you can see it covers the period from 9.30am when the market opened (4.30pm in South Africa) until about 2pm. You will notice the bold, blue horizontal line which gives the previous day’s close at 4226.52. What I want to draw your attention to is how important that previous day’s close was – and usually is.
The market opened up at around 4235, but then quickly fell below the previous day’s close. You should note how the S&P rallied three times to the previous close at 4226.52, each time failing to penetrate that level and falling back. After the third attempt, the bulls clearly lost heart and the index fell heavily down to the day’s low of 4210. There it formed a double bottom and began to rally. The rally was strong enough to take it above the previous day’s close – which then became the support level as the bears repeatedly tried to drive it down.
This principal of resistance becoming support once broken (and vice versa) is common in all types of charts.
The next chart shows the market action for Friday 11th June 2021:
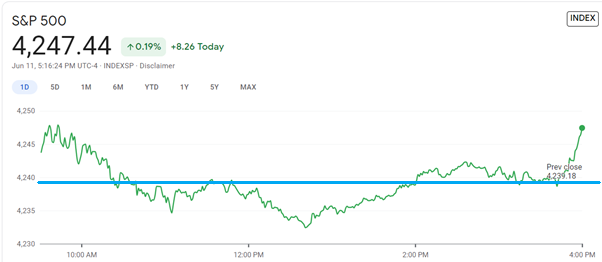
The index opened above the previous day’s close (4239.18) but fell quickly. Note that the previous day’s closing level did offer some support but was penetrated. Then it became a resistance level. When the index failed to penetrate the previous day’s close the bulls again lost heart and the index fell to its low for the day of about 4233. From there it began a new rally which took it up through the previous day’s close (after some resistance). That rally was fairly muted and came back down to test the previous day’s closing level (now a support level) several times. When support at 4239.18 held, the S&P moved rapidly higher to close at a new all-time record high of 4247.44.
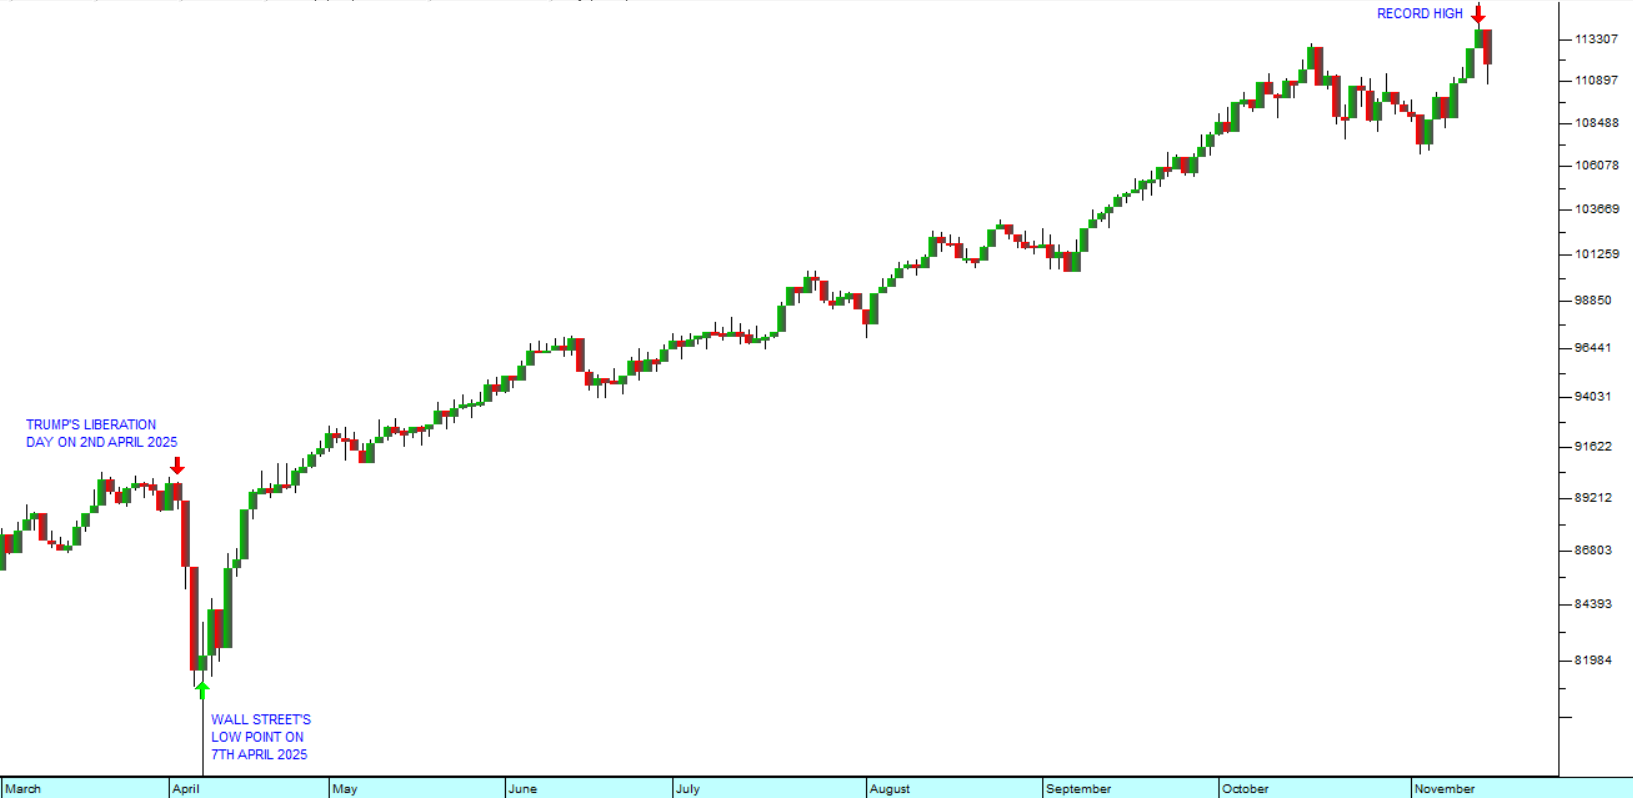
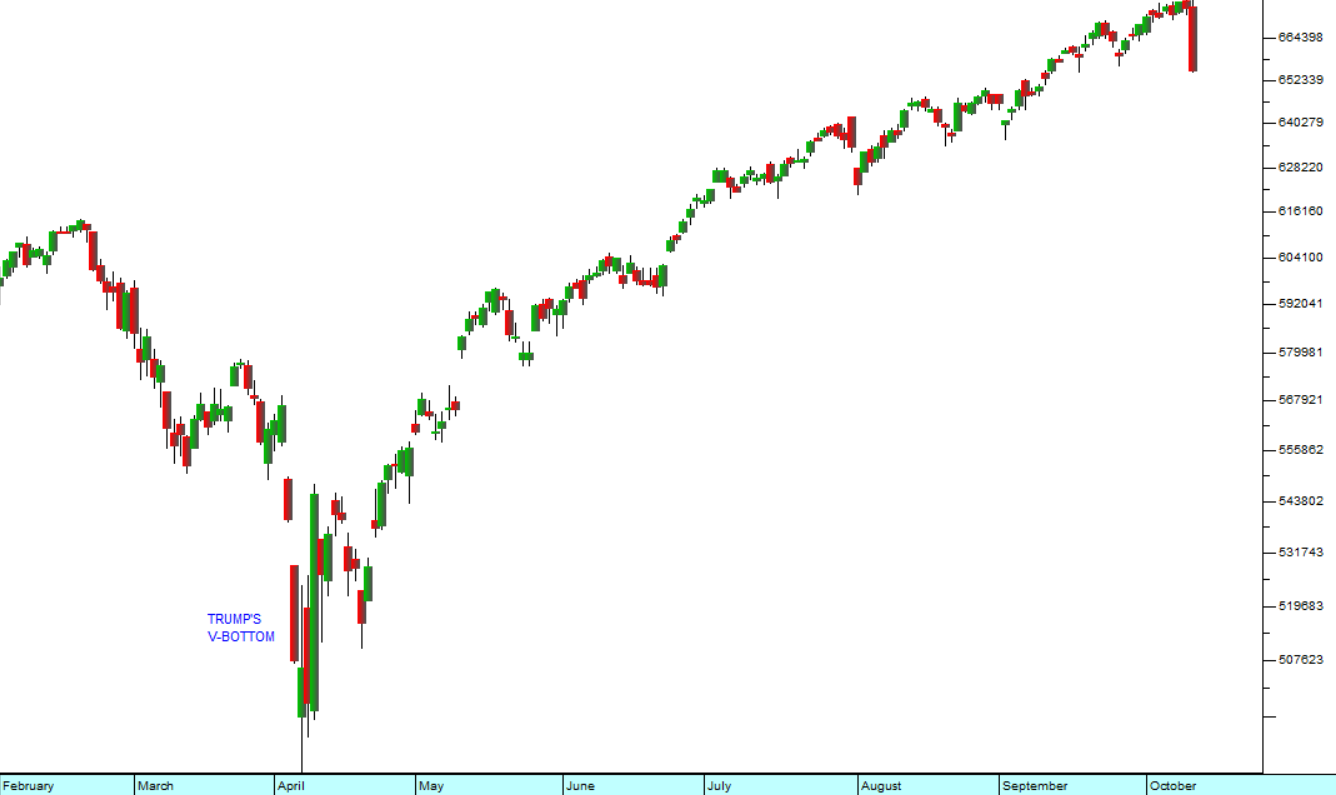
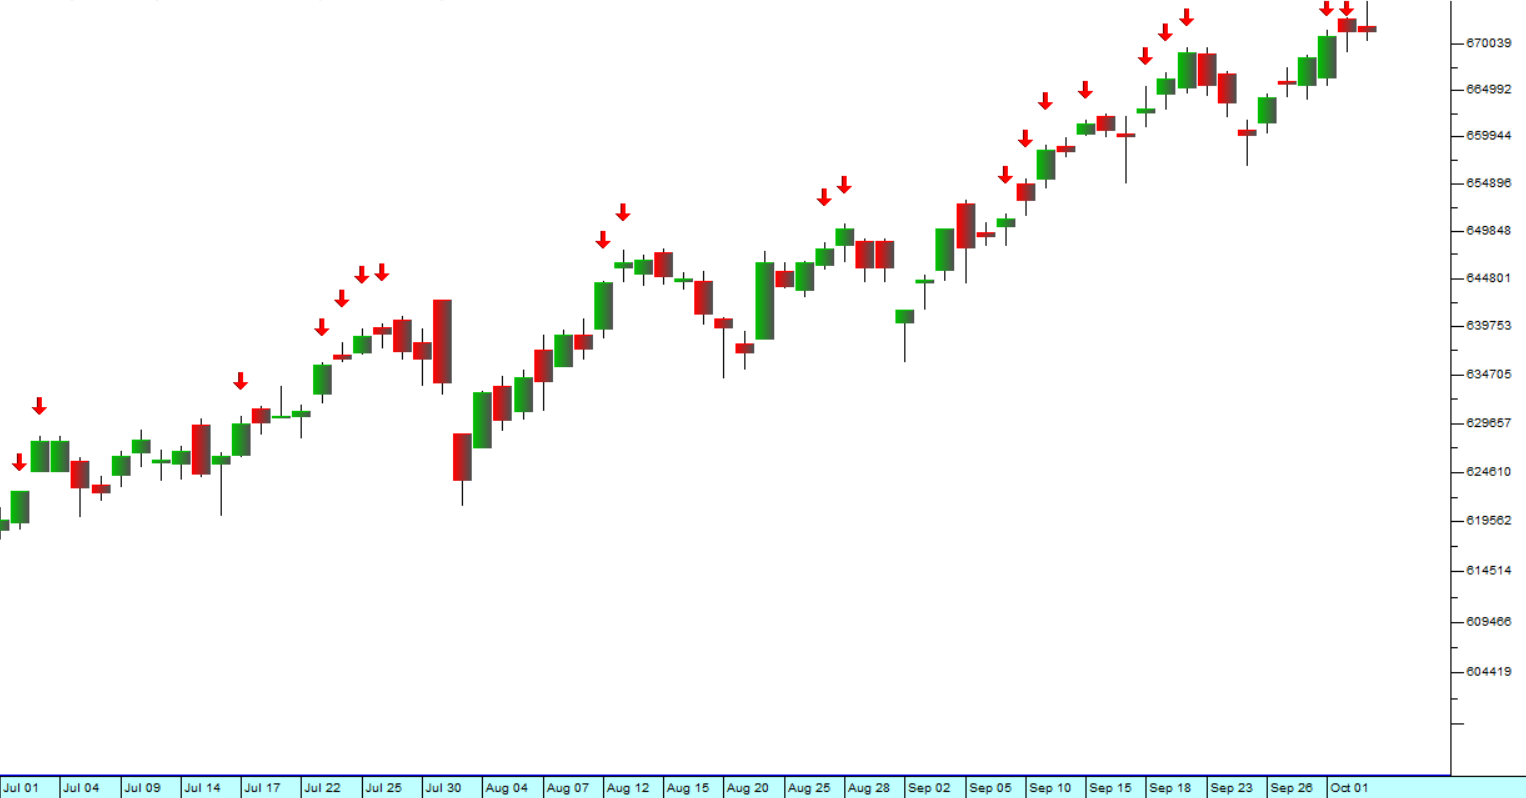
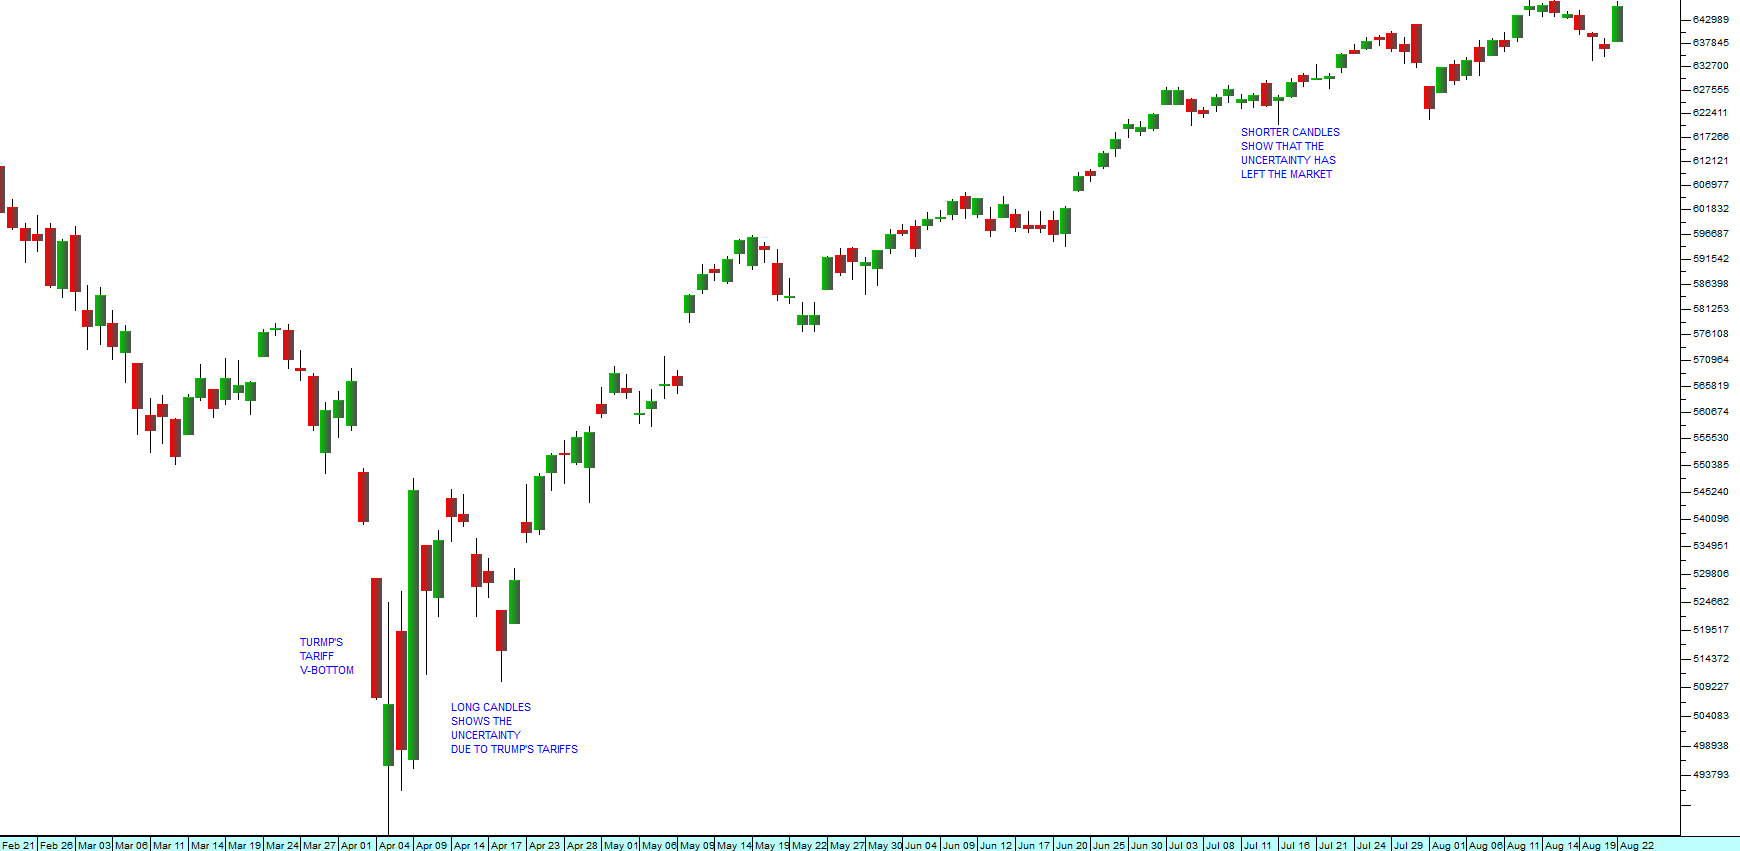
The following is a chart of the end-of-day candlesticks for the past 31 trading days on the S&P:
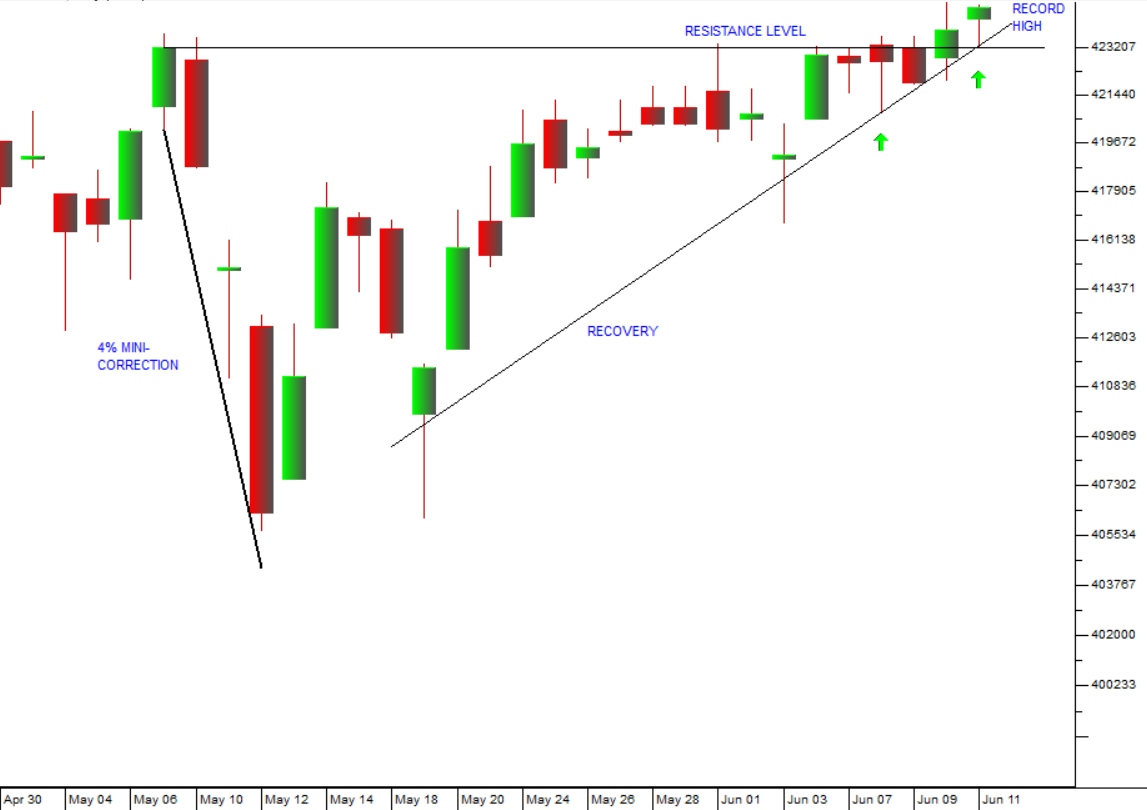
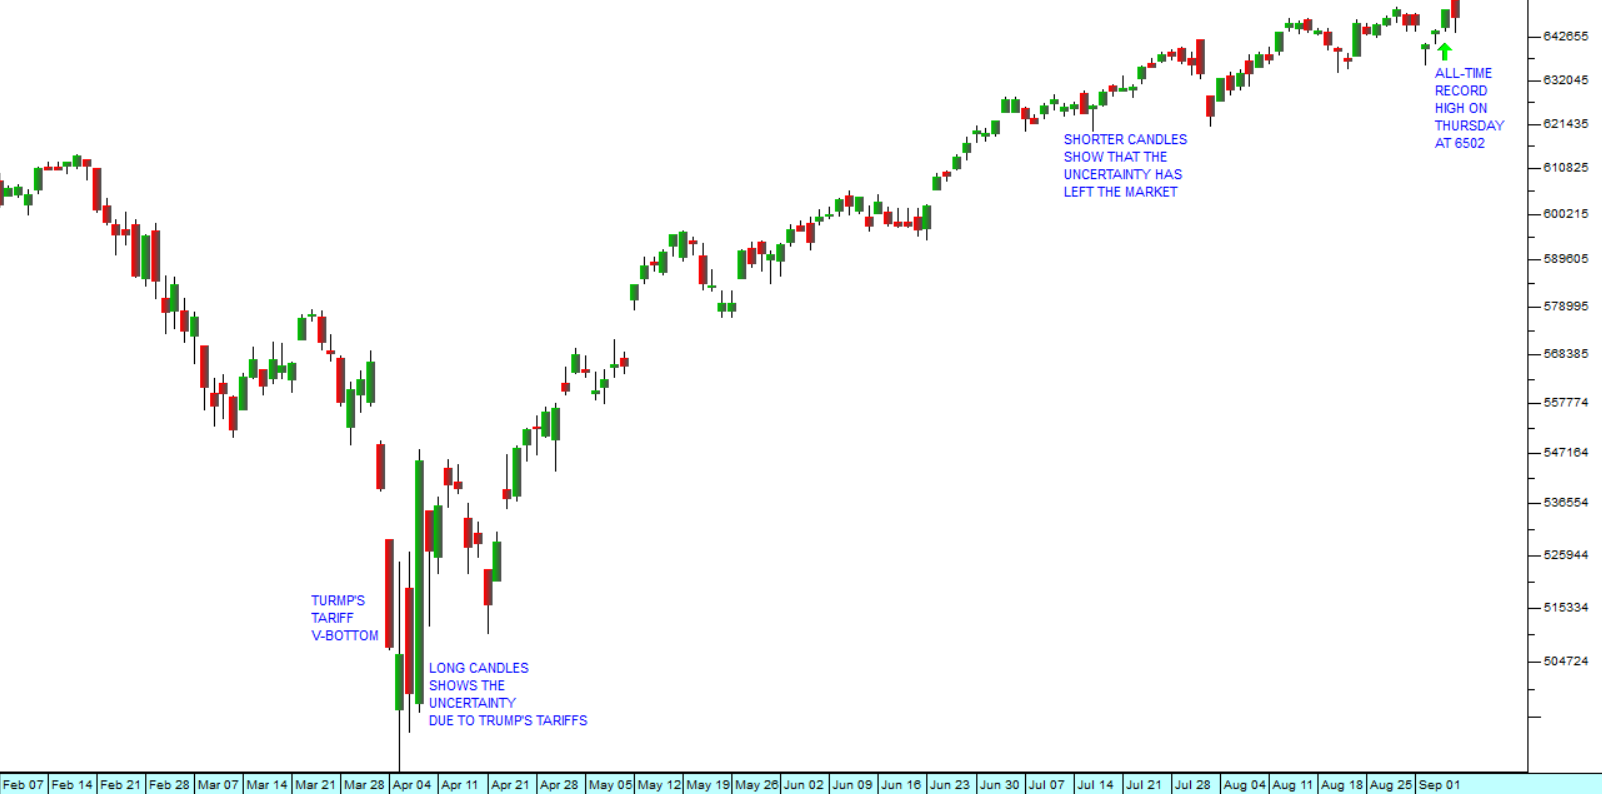
This shows the context within which the intra-day charts above took place. The candles representing those two days last week are identified by green arrows. They occurred as the chart was testing the previous record high (at 4232.6 on 7th May 2021) from before the 4% mini-correction. You can see that last week the candles bumped that previous high a number of times before it was finally broken on Friday and reached a new record high. The point is that end-of-day candles are actually a summary of what happened on Wall Street during the trading day, while the intra-day charts show the detail.
We advise you to watch the S&P500 index real time whenever you can. It is extremely instructive. You will see the importance of the previous period’s closing level and the significance of formations such as double tops and bottoms. These effects can also be useful in understanding end-of-day charts. After all, an individual candlestick is a summary of the market action of a single day.
DISCLAIMER
All information and data contained within the PDSnet Articles is for informational purposes only. PDSnet makes no representations as to the accuracy, completeness, suitability, or validity, of any information, and shall not be liable for any errors, omissions, or any losses, injuries, or damages arising from its display or use. Information in the PDSnet Articles are based on the author’s opinion and experience and should not be considered professional financial investment advice. The ideas and strategies should never be used without first assessing your own personal and financial situation, or without consulting a financial professional. Thoughts and opinions will also change from time to time as more information is accumulated. PDSnet reserves the right to delete any comment or opinion for any reason.
Share this article: